
I truly think that no matter what your platform is, you must have access to a comfortable development environment and a working debugger is one of the most important part of it. Remote debugging can be very helpful: it is possible to execute code on a remote machine and benefit from a nice debugging experience locally in your favorite code editor.
In this blog post I propose to review the setup of Python remote debugging with the portable and popular code editor VSCode. Actually VSCode documentation provides some very short instructions. In this blog post we will provide more explanations.
Prerequisite
We will assume that we do not have any security constraints. Precisely, we do not care about MITM interceptions between our client and remote server. We will discuss in appendix how we could solve this using SSH portforwarding.
We assume that the reader is familiar with the usage of a debugger in VSCode. In addition, we assume that the reader knows how to logon on a remote machine using SSH.
Our example
In this blog post we used an Ubuntu Azure Virtual Machine. Its configuration, RAM, GPU etc. are independent so you can basically choose anything.
We assume now that the reader has an Azure Ubuntu server running and is able to logon through SSH. Note that in VSCode documentation SSH portforwarding is mentioned but we will ignore it for now.
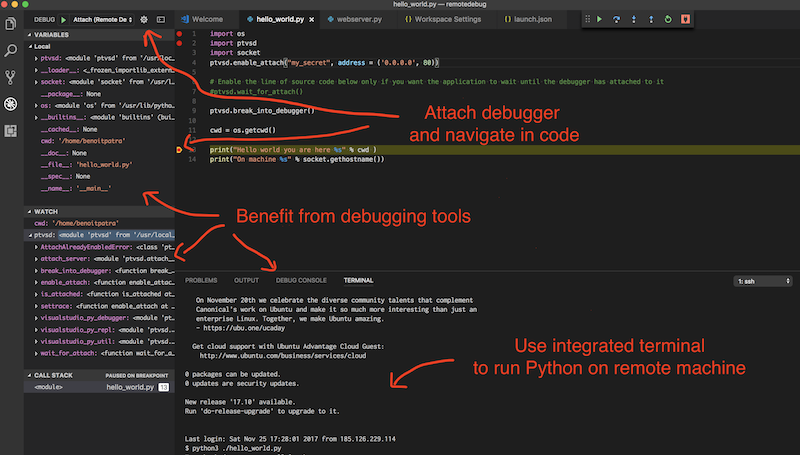
Let us present precisely what remote debugging is. In this post, the name remote stands for our Ubuntu VM on Azure while the client is our local, e.g. MACOS, computer. With remote debugging only a single Python process is executed on the remote VM then, on client computer, VSCode “attach itself” to this remote process so you can match the remote code execution with your local files. Therefore, it is important to keep exactly the same .py files on client and in host so that the debugging process is able to match line by line the two versions.
The magic lies in a library called ptvsd that makes the bridge for attaching local VSCode to remotely executed process. The remotely executed Python waits until the client debugging agent is attached.
Obviously network communication is involved here and that is actually the major pitfall when configuring remote debugging. The VSCode documentation is fuzzy about whether to use IP or localhost which port to set etc. We will try to simplify things so the debugging experience becomes crystal clear.
Networking
To make things simpler we decided to show an example where the Python process is executed on a remote machine whose IP address is 234.56.45.89 (I chose this address randomly). We use the good old port 80 for the communication (the usual port for http).
Before doing anything else we need to make sure that our remote VM network configuration is ok. We will make sure that machine 234.56.45.89 can be contacted from the outside world on port 80.
Firstly, using an SSH session on remote machine we will start a webserver using the following Python3 command. You may need elevated privilege for listening on port 80 (for real production usage give this privilege to the current user, do not sudo the process).
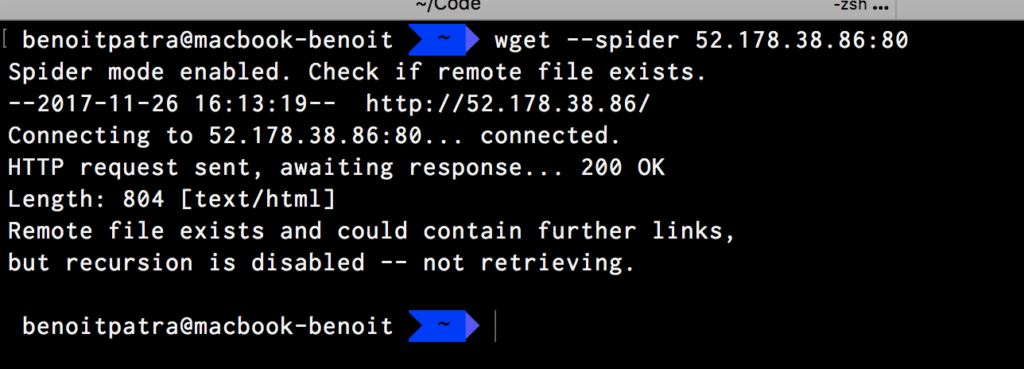
Secondly on a client terminal you should be able request your machine using wget (spider mode to avoid file download). In this command the target machine is accessed with IP:PORT
You should get response from the server. If you see some errors, you mat need to open the 80 port in firewall configuration, see instructions here for Azure.
At this stage your network configuration is ok. You can stop the Python command that runs the webserver.
Configuring VSCode
Make sure that you have the VSCode Python extension installed. Follow the instructions here to add a new Debug configuration in your launch.json containing the following JSON configuration.
It is important to understand that this configuration is only for VSCode. The host corresponds to the machine where the remote Python process is ran. The port corresponds to the port that will be used by the remote process to communicate with the client debugging agent, in our case it is 80.
You must specify the root folders, on both local environment and on the remote machine.
That’s it for VSCode configuration.
The code under debugging
Let us debug the following Python script
As explained in the introduction, the Python file must be the same on client and on remote machine. There is one exception yet, the line ptvsd.wait_for_attach() must be executed by remote Python process only. Indeed, it tells the Python process to pause and wait that the client is attached to continue.
Of course in order to execute it you may need to install dependencies (for example using Pip) so it executes on the remote machine.
REMARK: looks like at the time of the writing version of ptvsd>3.0.0 suffers some problems. I suggest that you force the install of version 3.0.0, see this issue.
It is important to understand that enable_attach, enable_attach, break_into_debugger are instructions for the remote Python process. The first line ptvsd.enable_attach("my_secret", address = ('0.0.0.0', 80)) basically instructs the remote Python process to listen on all network interfaces, on port 80 for any client debugger that would like to attach. This client agent must provide the right secret (here my_secret).
The line ptvsd.break_into_debugger() is important, it is the line that allows to break and navigate in code with client VSCode.
Putting things together
Now you are almost ready. Make sure your Python file is duplicated on both local and remote at root location. Make sure the ptvsd.wait_for_attach is uncommented and executes on remote environment.
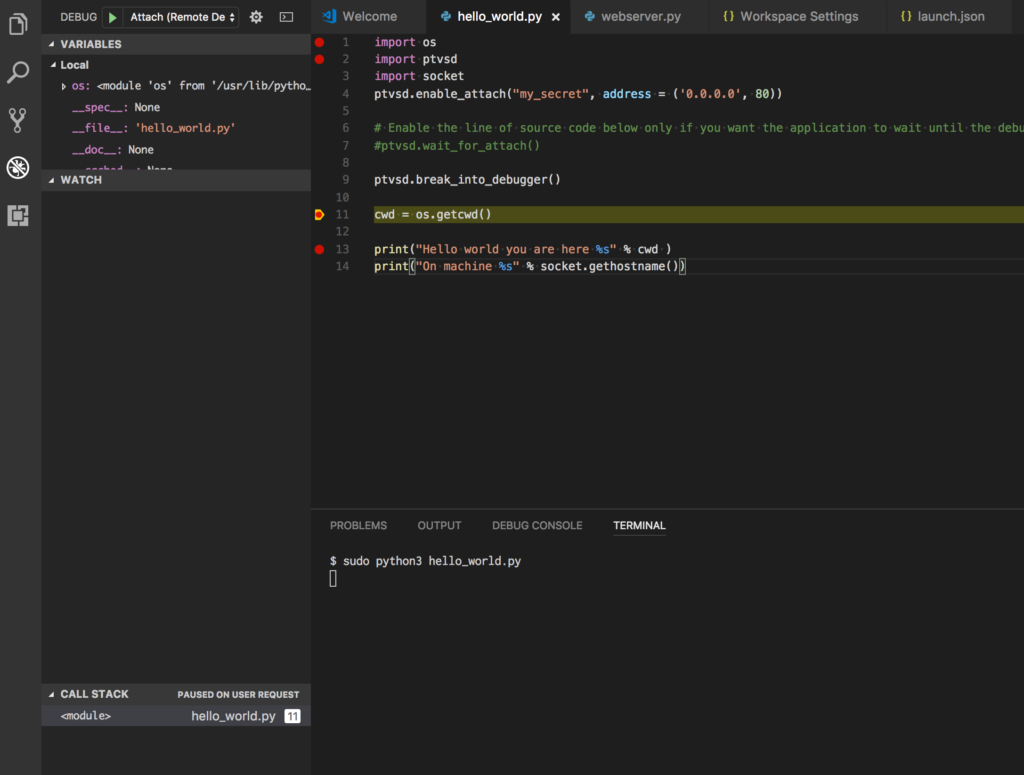
Now using an SSH session on remote machine. Start the Python process using elevated privileges
sudo python3 your_file_here.py
This should not return anything right now and should be hanging, waiting for your VSCode to attach the process.
Set a VSCode break point just after ptvsd.break_into_debugger(), make sure that in VSCode the selected debugging configuration is Attach (Remote Debugger). Hit F5, you should be attached and breaking in code !
What a relief, efficient working ahead !
Going further
The debugging procedure described aboved is simplified and suffer some flaws.
Security constraints
Here anybody can intercept your traffic, it is plain unencrypted http traffic. A recommended and yet simple option to secure the communication is to use SSH port forwarding tunnelling. It basically creates an encrypted network communication between your localhost client and the remote machine. When an SSH tunnel is setup, you can talk to your local machine on a given port and the remote receives call on another port (magic, isn’t it?). Therefore the launch.json configuration should be modified and host value is localhost. Note also that the port in Python code and in launch.json may not be the same, you have two different ports now.
Copying files
We pointed out that the files must be the same between local env and remote. We advise to group in a shell script: the files mirroring logic (using scp) and the execution of the Python process on remote machine.
Handling differences between local and remote files
We said that the files must the same between local env and remote but we need some differences at least to allow the execution of ptvsd.wait_for_attach on remote.
This is definitely something that can be handled in an elegant manner using environment variables.
Of course you need to pass now the environment variable to you remote process with SSH, see this stackexchange post to know how to do that.
Comments